In all treatments, subjects are asked to roll a virtual die and report the outcome of the first roll. Treatment variations are built on:
how many times they can roll
the outcome of the die and
timing of the rolling opportunities.
Single Roll: The control group is allowed to roll only once before they report the outcome, and the outcome of the die is a number. After reporting, they are allowed to roll as many times as they want.
Three Rolls: Subjects are given the chance to roll 3 times before they report, and the outcome of the die is numbers. They are not given chance to roll after reporting.
Free Rolls (numbers): Subjects are allowed to roll as many times as they want before reporting, and the outcome is numbers.
Free Rolls (symbols): Subjects are allowed to roll as many times as they want before reporting, and the outcome of the die is symbols after the first roll.
The analysis focuses on the hypotheses in the pre-analysis plan and some other aspects of the results to investigate strategic curiosity. We use strategic curiosity to define the desire to collect more information when it can be used for one’s benefit. Curiosity is strategically triggered to justify one’s own dishonesty by rolling the die more to see a higher outcome.
Our design enables us to investigate curiosity from two different angles:
Information Type: In Free Rolls (numbers), subjects see numbers after the first roll, while in Free Rolls (symbols), they see only figures after the first roll. In Free Rolls (numbers), information is relevant to the outcome, and in Free Rolls (symbols), they face irrelevant information. In both treatments, rolling behavior follows similar patterns; subjects with low first-rolls are more likely to roll multiple times, and the total number of rolls is not significantly different between the two treatments.
Time of the Information: In Single Roll, subjects can roll as many times as they want after reporting (ex-post), and in Free Rolls (numbers), they have the same chance before reporting (ex-ante). Our results show no significant difference between these two treatments regarding dishonesty. On the other hand, the rolling behavior is similar; subjects with lower first-roll outcomes are more likely to roll. In Free Rolls (numbers), the highest number they see before reporting increases dishonesty. In Single Roll, subjects who misreported are more likely to roll more ex-post.
You can download the data here:
Descriptive Statistics
The experiment is conducted on Amazon Mechanical Turk in June-July 2019. In total, 1580 participants joined the experiment,but after implementing exclusion criteria to ensure the completion of the experiment and the provision of logical answers, only a subset of them, represented as 1559 remained. Specifically we exclude those who reported lower numbers than they actually saw in the first roll, or those who attempted to earn less than they were supposed to.
The two tables below show descriptive statistics about the sample across different treatments. It is evident that the majority of participants are male, and this gender distribution is consistent across all treatments.
| Single Roll | Three Rolls | Free Rolls (numbers) | Free Rolls (symbols) | p.overall | |
|---|---|---|---|---|---|
| N=406 | N=382 | N=388 | N=383 | ||
| age | 39.0 (12.5) | 38.4 (10.5) | 39.0 (12.1) | 37.9 (11.5) | 0.525 |
| sex_f | 0.45 (0.50) | 0.45 (0.50) | 0.48 (0.50) | 0.48 (0.50) | 0.740 |
| education: | 0.607 | ||||
| High school or less | 45 (11.1%) | 44 (11.5%) | 52 (13.4%) | 40 (10.4%) | |
| Higher than highschool | 361 (88.9%) | 338 (88.5%) | 336 (86.6%) | 343 (89.6%) | |
| political | 3.16 (2.42) | 3.45 (2.38) | 3.46 (2.48) | 3.39 (2.38) | 0.253 |
| total_rolls | 1.00 (0.00) | 3.00 (0.00) | 4.35 (9.62) | 4.75 (17.7) | <0.001 |
| practice_rolls | 5.04 (5.43) | 5.01 (6.66) | 4.90 (5.82) | 5.37 (6.72) | 0.753 |
| report_roll | 3.95 (1.79) | 4.17 (1.71) | 3.95 (1.75) | 4.13 (1.66) | 0.156 |
| observe | 6.75 (3.14) | 6.82 (3.37) | 7.00 (3.23) | 7.02 (3.25) | 0.574 |
| legit | 3.73 (3.74) | 2.30 (3.08) | 3.28 (3.72) | 3.32 (3.72) | <0.001 |
| curious | 4.18 (3.42) | 5.77 (3.35) | 4.24 (3.80) | 4.15 (3.48) | <0.001 |
In this section, we focus on the registered hypotheses in our Pre-Analysis Plan.
Dishonesty
We start our analysis by investigating the dishonest behavior across treatments.
Hypothesis 1 and Hypothesis 2: In our pre-analysis plan, we hypothesized that participants who can observe more information in Three Rolls and Free Rolls (numbers) would be more likely to behave dishonestly compared to Single Roll and Free Rolls (symbols).
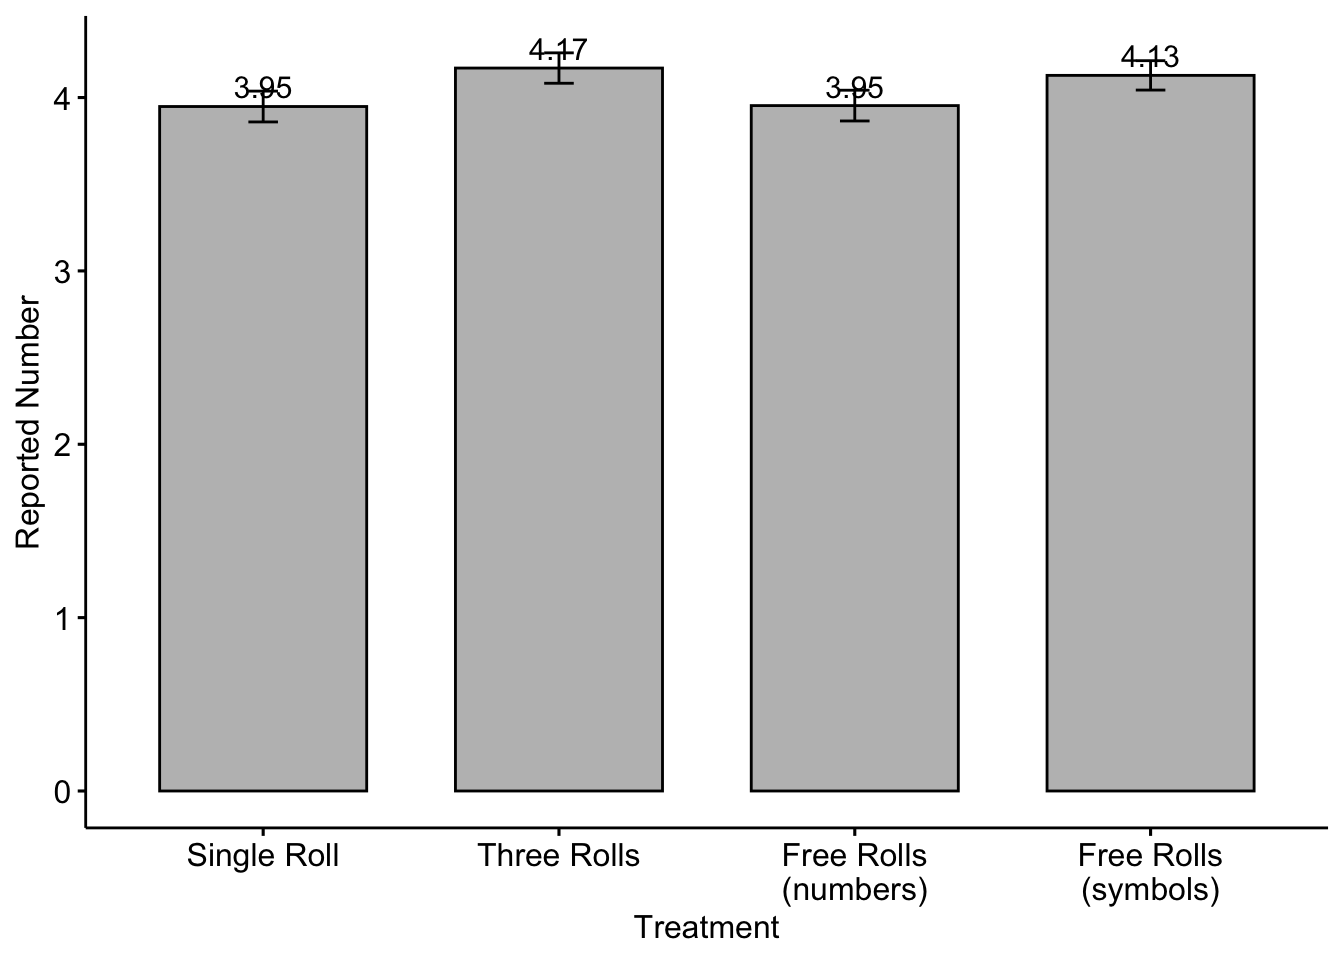
The figure below displays the average reported numbers by treatment, with standard errors represented by the bars.
Hypothesis 3a and 3b: We hypothesized that observing a higher number on the subsequent rolls would offer stronger justification for dishonesty. Consequently, we anticipated that individuals who witnessed a higher outcome on their subsequent rolls compared to their initial roll would exhibit greater dishonesty.
To test this hypothesis, we present several outcomes below.
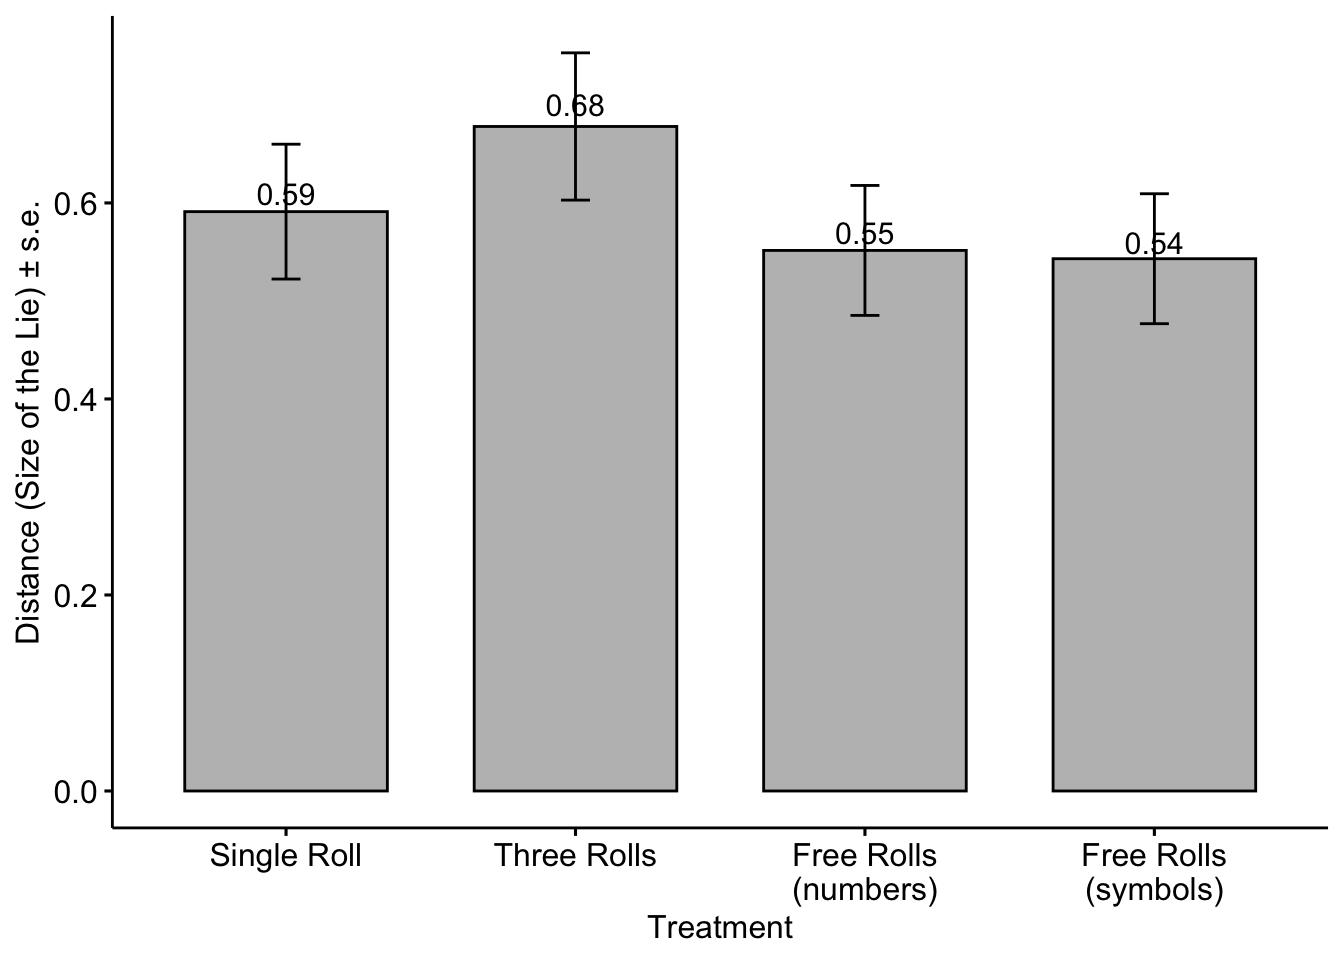
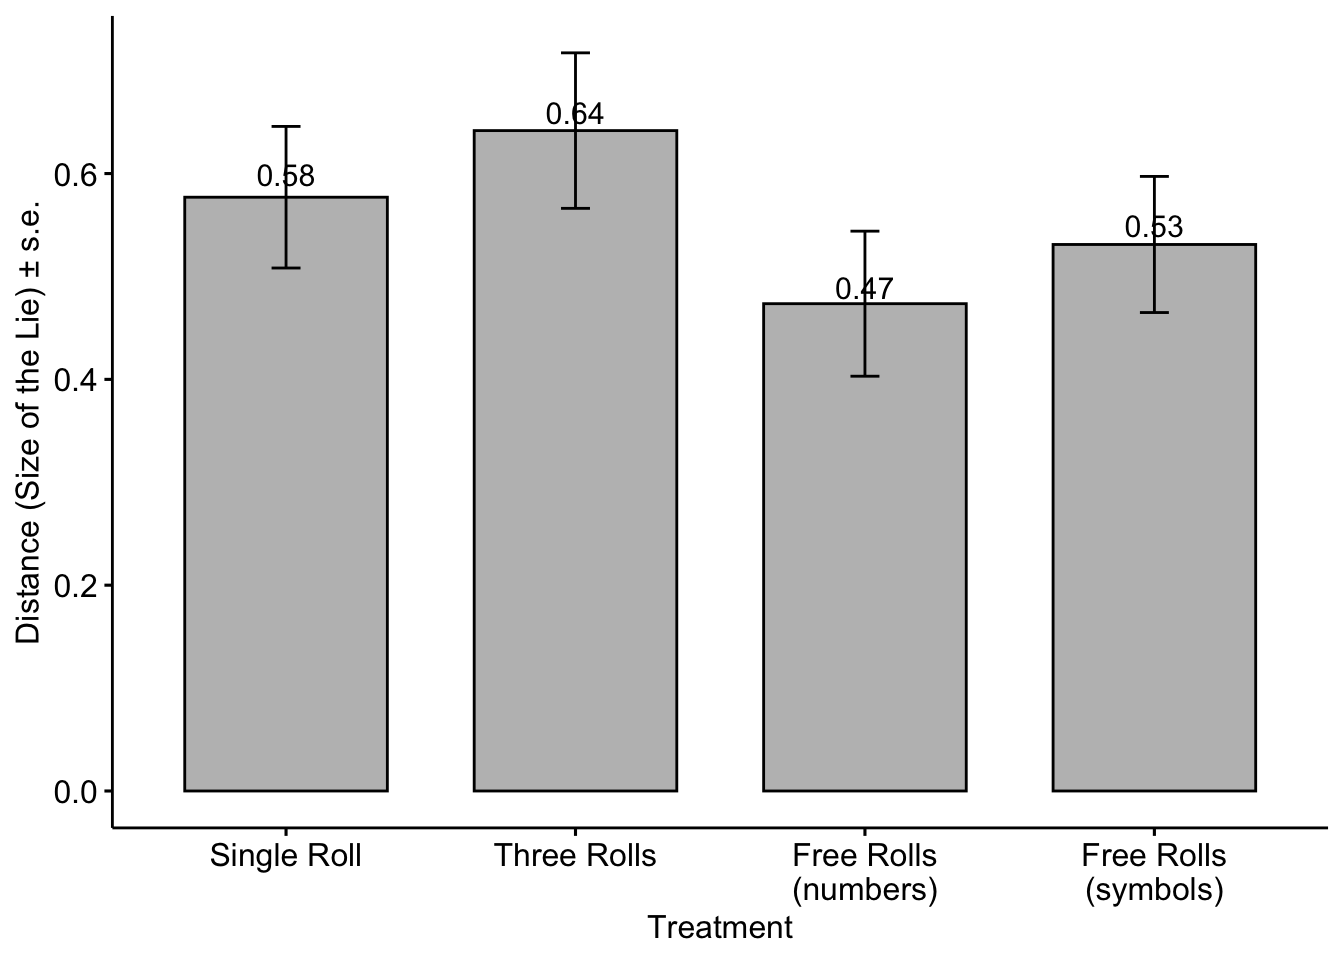
Because we were able to compare the actual results with the reported ones, we offer a metric to assess the extent of deception, known as the intensive margin of the lie. This metric quantifies the difference between the reported number and the actual outcome of the first roll.
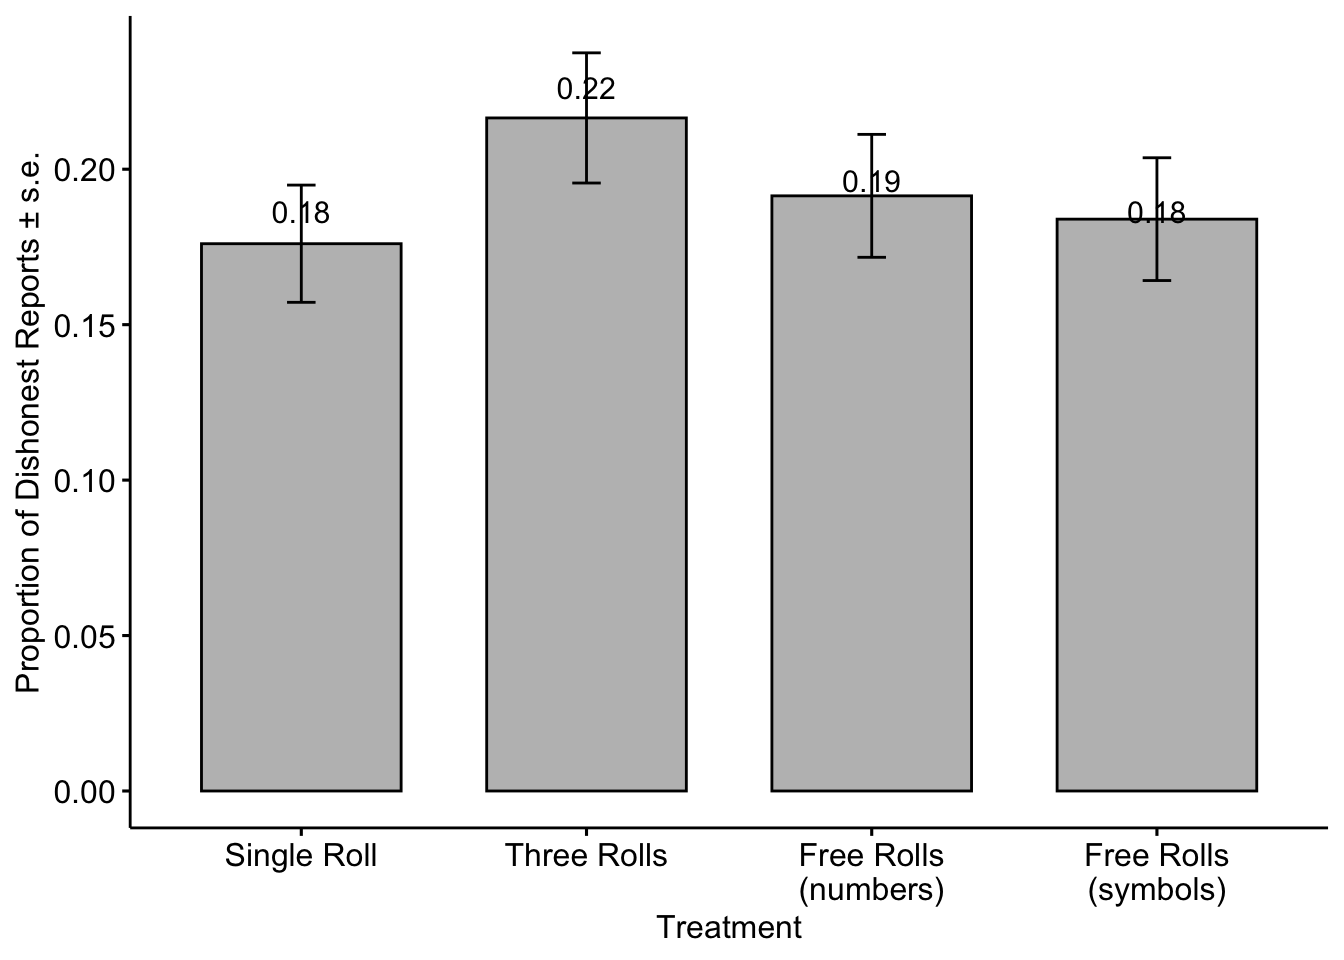
The figure below shows the proportion of dishonest reports in each treatment or the extensive margin of the lie.
Distribution of reported numbers
Figure below shows the distribution of reported numbers for each treatment.
Does observing numbers increases honesty?
Participants who observe higher numbers in the additional rolls are more likely to report dishonestly compared to those who observe lower or the same number.
We have observed that participants who see higher numbers tend to be more dishonest than those who were in Single Roll, whereas participants who observe lower or the same numbers tend to be less dishonest than those who were in Single Roll.
[1] FALSE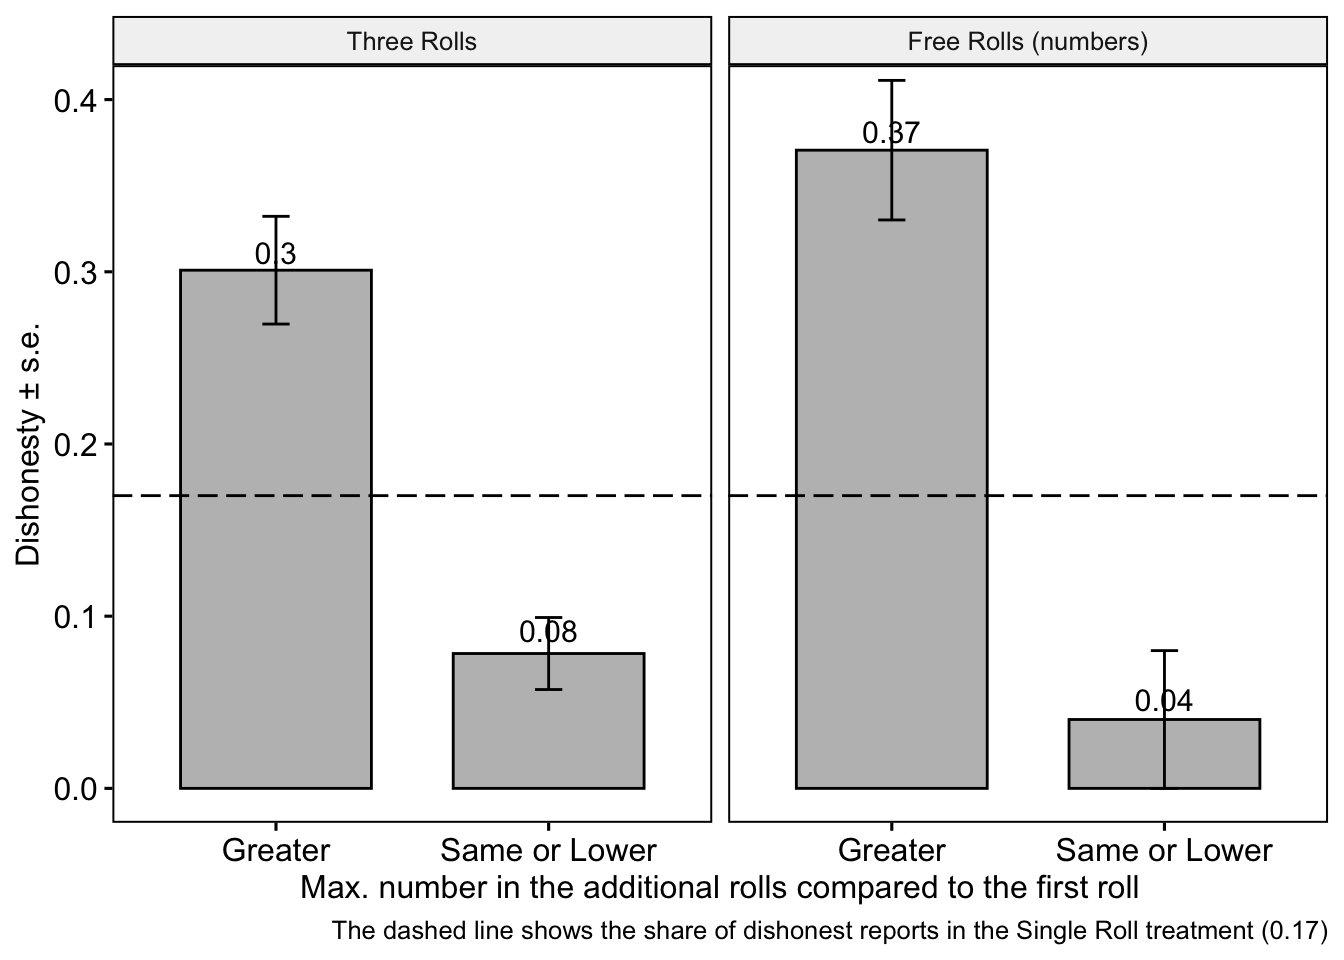
Rolling Behavior - Curiosity
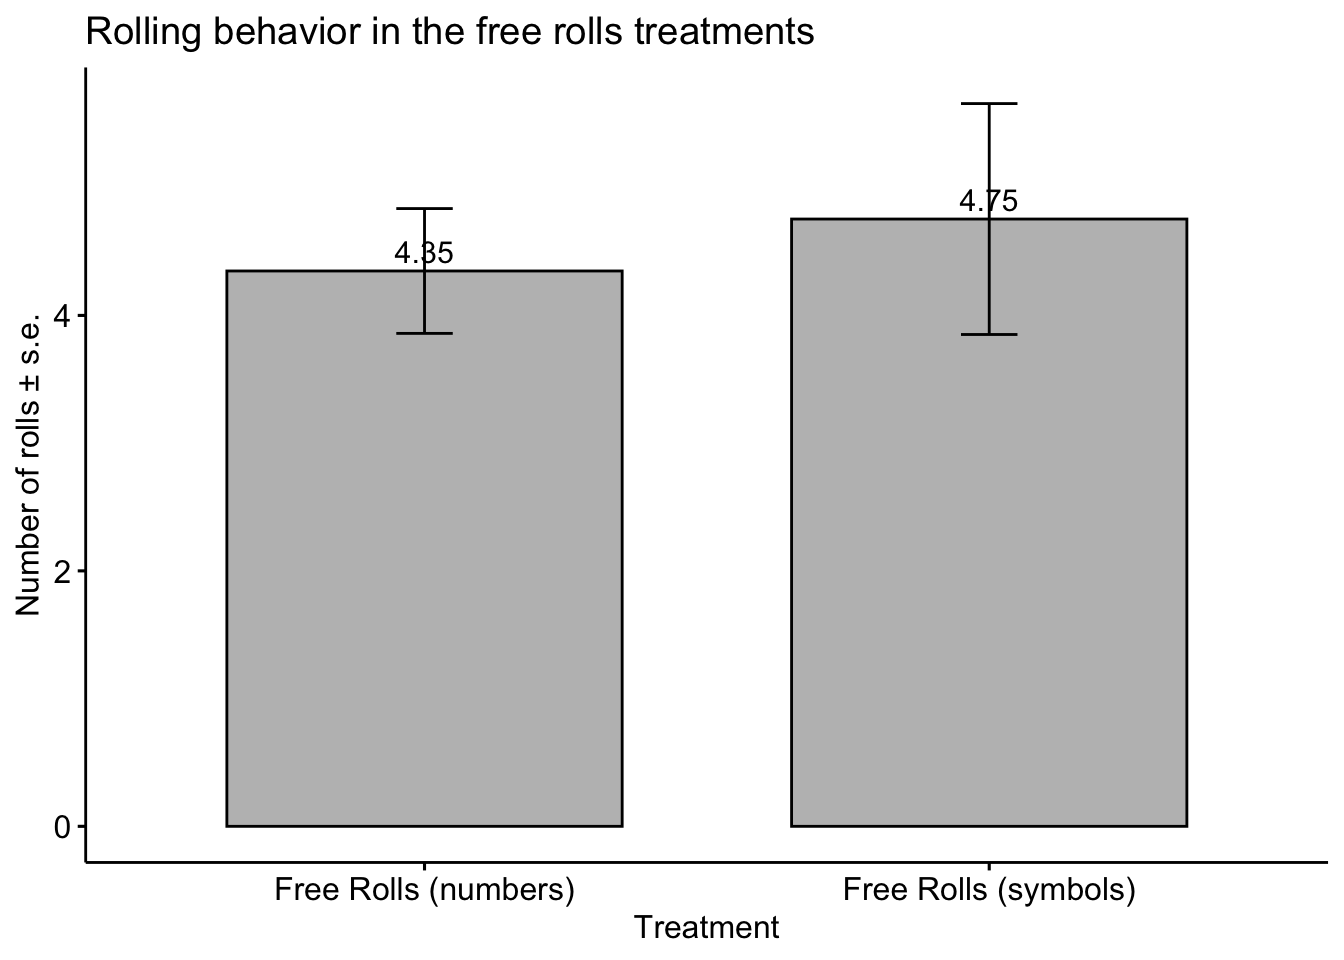
To examine the rolling behavior and how it interacts with dishonesty and the content of the die, we present further results in this section. In the figure below, we present the mean number of rolls in the Free Rolls (numbers) and Free Rolls (symbols) treatments. We find no significant difference in the mean number of rolls between these two treatments, indicating the content of the die did not have much effect on the rolling behavior.
Why Keep Rolling?
The figure below illustrates that players who saw lower (<3) outcomes in their initial roll were more inclined to engage in additional rolls in Single Roll, Free Rolls (numbers), and Free Rolls (symbols). This demonstrates that obtaining a lower outcome serves as a motivation for rolling the die more.
[1] FALSE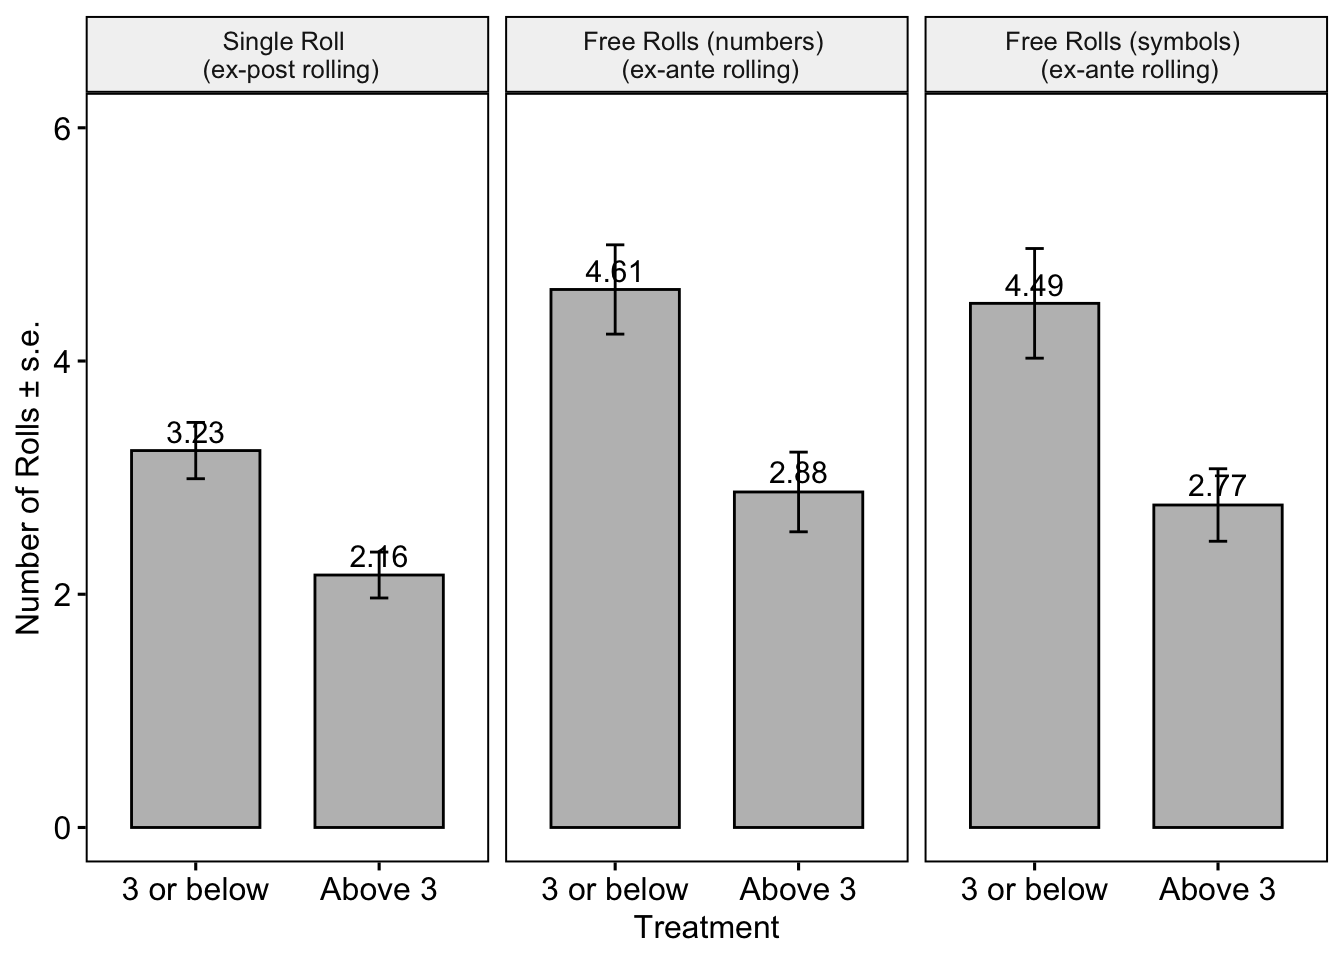
Why Roll Ex-Post?
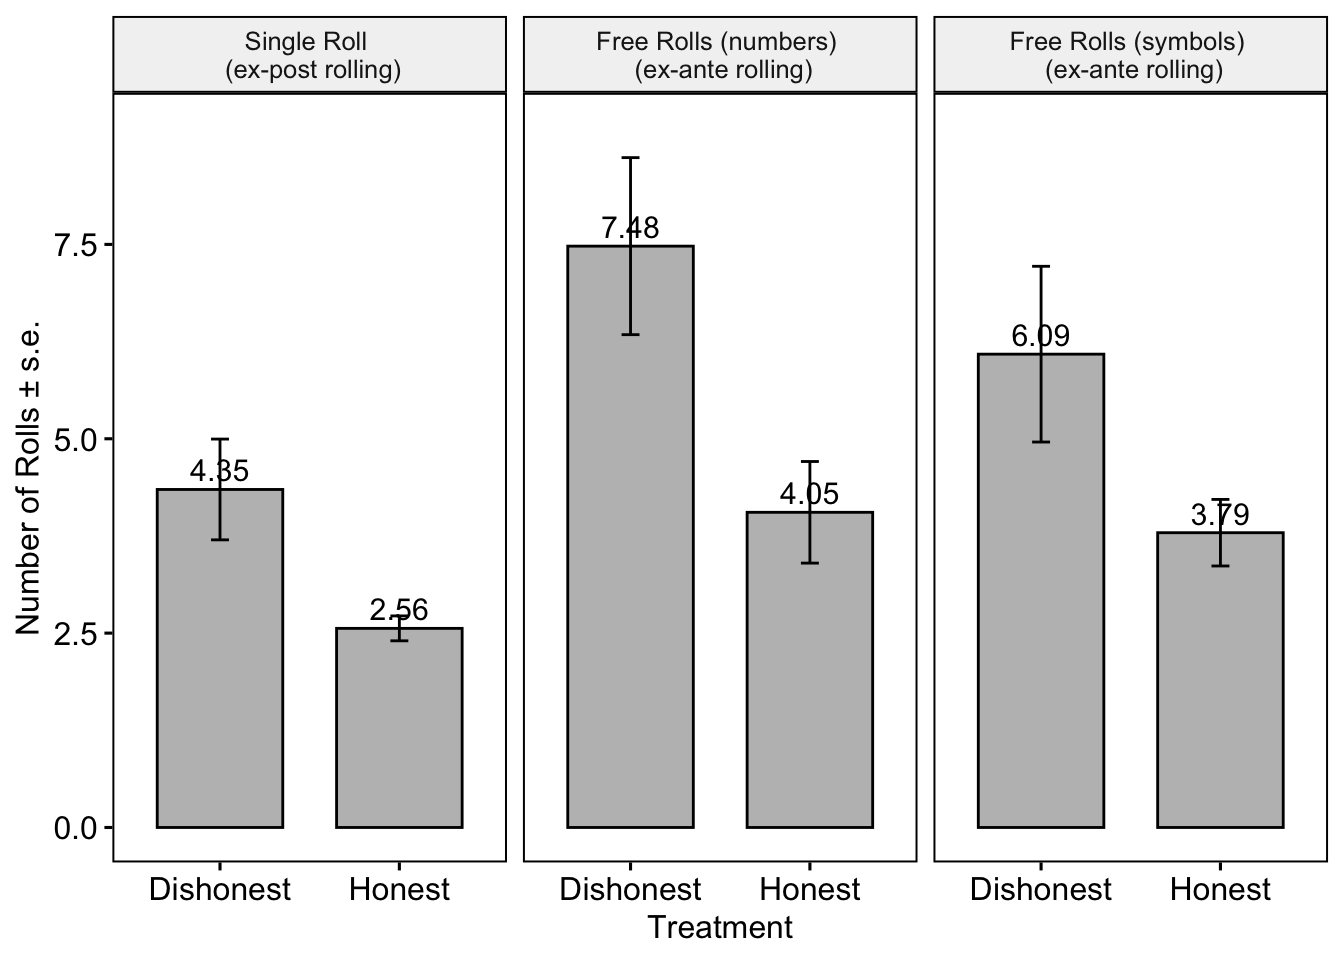
In the Single Roll condition, we observed a high number of rolls even after reporting. To investigate post-report rolling, the figure below shows that players who misreported were more likely to roll after reporting. We report the same numbers for Free Rolls treatments as well. Across all these treatments, the differences between the dishonest and honest participants are significant (Wilcoxon test, p = 0.01, p<0.001, p<0.001 from left to right).
Liars
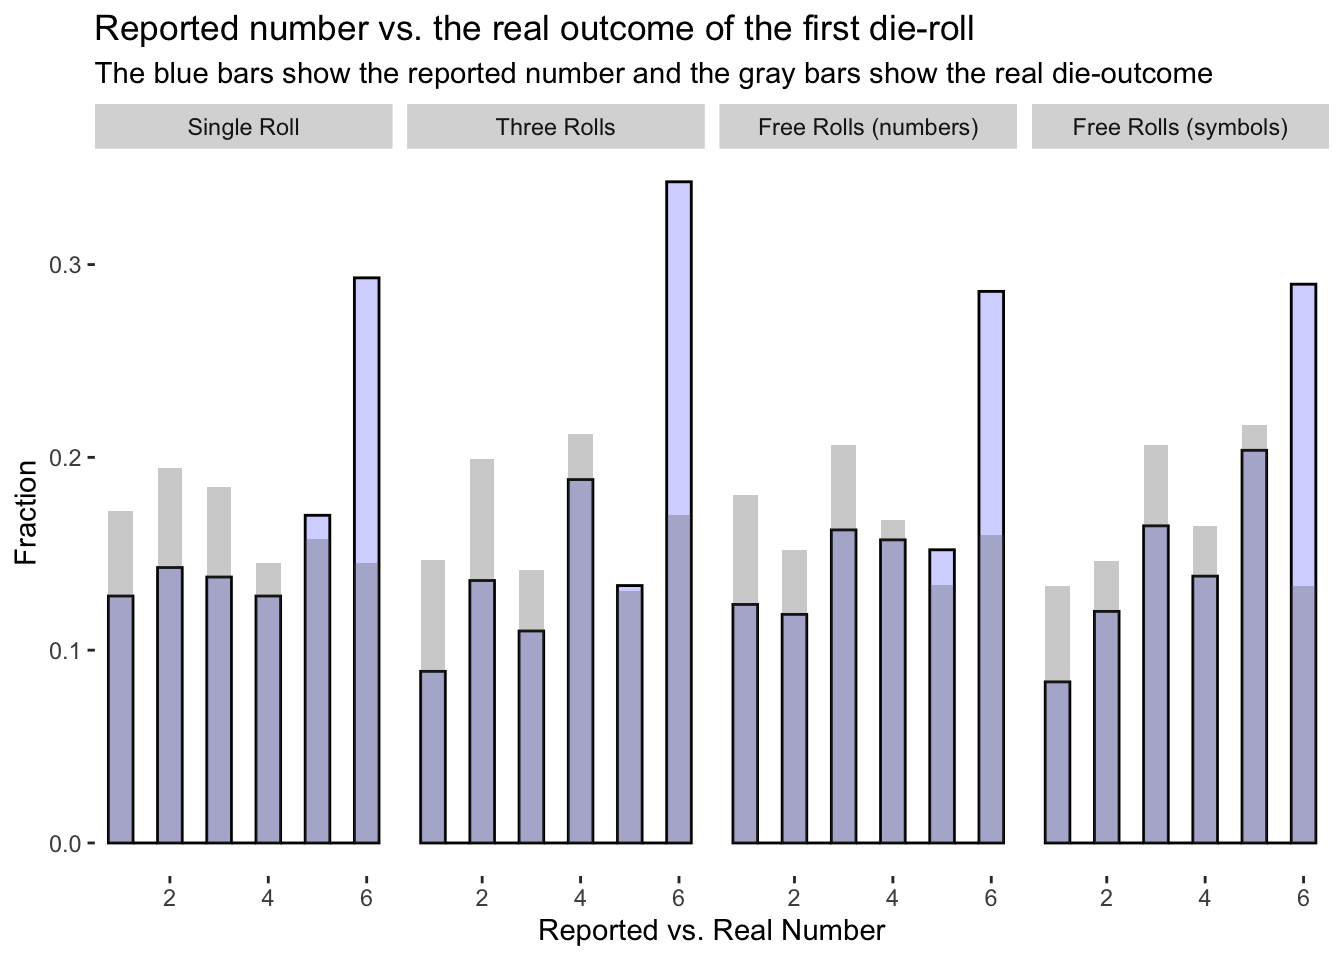
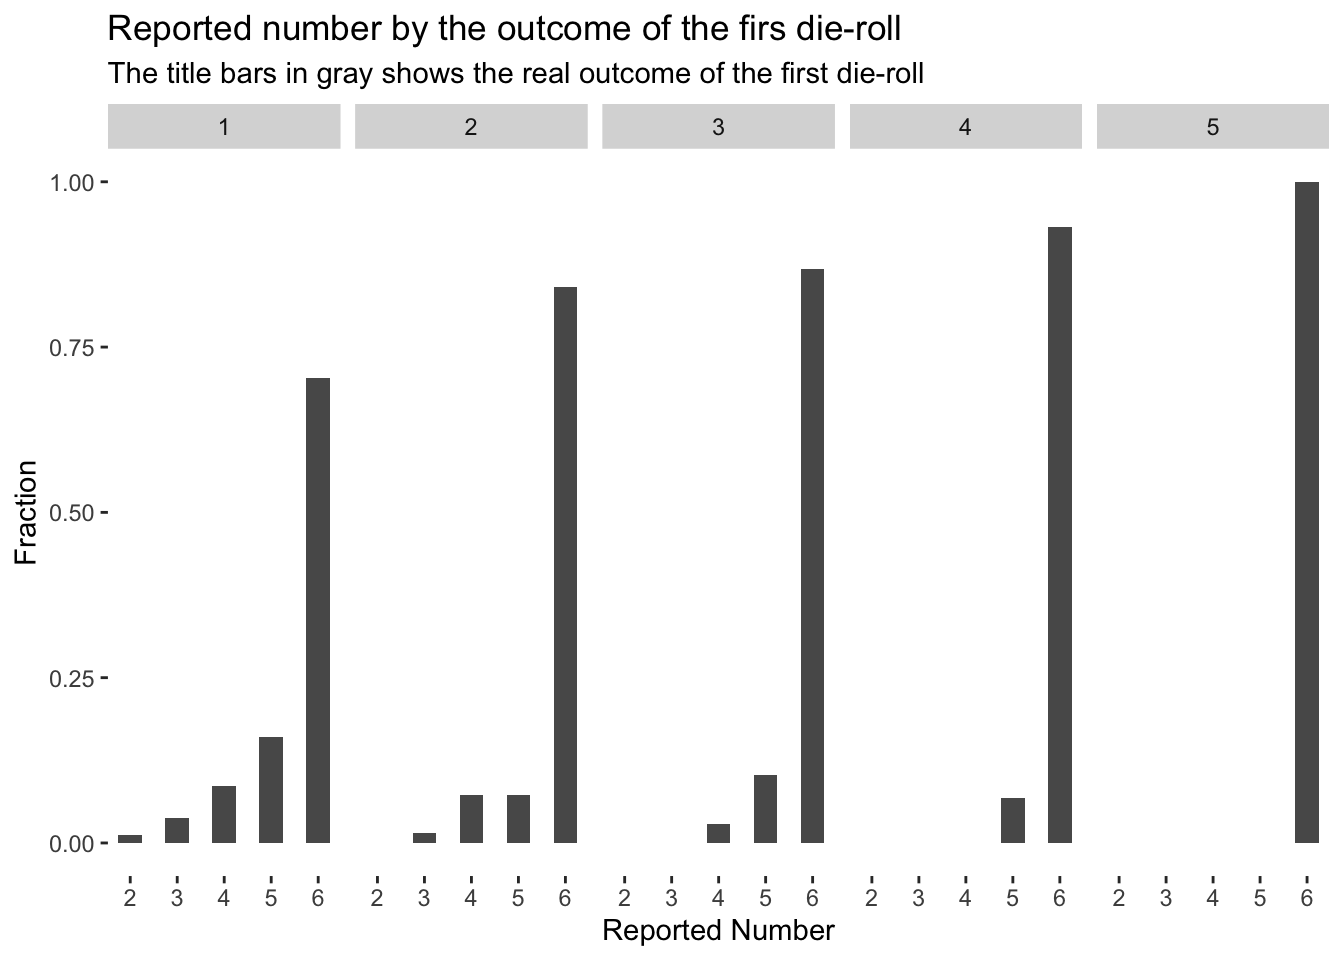
The figure below depicts the distribution of reported numbers based on the outcomes of the first die-roll. The x-axis represents the reported numbers, while the y-axis displays the corresponding fractions. The plot is divided into facets according to the outcomes of the first die-roll, which are shown in the upper section. The data in the plot are limited to participants who reported dishonestly. It is evident that the majority of dishonest participants consistently reported 6, regardless of the initial low outcome of the first die-roll.
Determinants of the “distance”
This table shows regression estimation for reported number-first roll outcome.
The identification strategies we use are as below:
\[ distance=\beta_0+\beta_1\times \log(number of rolls+1)+\beta_2\times treatment+\beta_3\times demographics+\epsilon \tag{1}\]
\[ distance=\beta_0+\beta_1\times log(number of rolls+1)+ \beta_2 \times treatment\times first\_roll+\beta_3\times demographics+\epsilon \tag{2}\]
| Dep. var. : distance | ||
| Reported number - Real outcome | ||
| (1) | (2) | |
| Log(Number of rolls+1) | 0.433*** | 0.287*** |
| (0.073) | (0.061) | |
| Three Rolls | -0.182 | 0.202 |
| (0.121) | (0.206) | |
| Free Rolls (numbers) | -0.301** | -0.370* |
| (0.118) | (0.207) | |
| Free Rolls (symbols) | -0.329*** | -0.243 |
| (0.117) | (0.216) | |
| Number of practice rolls | -0.010 | |
| (0.006) | ||
| First roll | -0.279*** | |
| (0.037) | ||
| Age | -0.013*** | -0.011*** |
| (0.003) | (0.003) | |
| Female | -0.340*** | -0.269*** |
| (0.079) | (0.064) | |
| Higher education | -0.049 | -0.052 |
| (0.124) | (0.099) | |
| Three Rolls X First roll | -0.081 | |
| (0.053) | ||
| Free Rolls (numbers) X First Roll | 0.055 | |
| (0.053) | ||
| Free Rolls (symbols) X First roll | 0.028 | |
| (0.055) | ||
| Constant | 1.139*** | 1.943*** |
| (0.196) | (0.202) | |
| Observations | 1,322 | 1,559 |
| R2 | 0.061 | 0.172 |
| Adjusted R2 | 0.055 | 0.166 |
| Residual Std. Error | 1.418 (df = 1313) | 1.248 (df = 1547) |
| F Statistic | 10.577*** (df = 8; 1313) | 29.124*** (df = 11; 1547) |
| Note: | p<0.1; p<0.05; p<0.01 | |
Note: Number of practice rolls shows the number of die rolls prior to the start of experiment, First roll shows the outcome of the first die roll, Higher education is the cutoff for education above high school.
Mediation Analysis
Hypothesis 4: We support our analysis on the determinants of dishonesty with mediation analysis
In our Pre-analysis plan, Hypothesis 4 plans out a mediation analysis in order to test whether the observation of desirable counterfactuals accounts for the increased dishonest reporting Three Rolls and Free Rolls (numbers) compared to Single Roll.
However, we cover this question in our regressions and correlation tables in the formal analysis of the paper. Here, we report similar results from the mediation analysis that is stated in the pre-analysis plan.
In order to test whether the observation of desirable counterfactuals accounts for the increased dishonest reporting in Free Rolls (numbers) and Free Rolls (symbols) compared to Single Roll, we estimate a mediation model.
We estimate a linear relationship between lying and treatment effects by using the highest observed outcome for each subject as a mediator of the expected effect. The mediator is the highest observed outcome from (max_of_additional). The independent variable in the model is treatment condition (treatment_d). We use Single Roll as reference group and compare it to Three Rolls and Free Rolls (numbers).
Bootstrap results
ORDINARY NONPARAMETRIC BOOTSTRAP
Call: boot(data = medi_data, statistic = indirectsaved, R = 10000, formula2 = max_of_additional ~ treatment_f, formula3 = steal ~ treatment_f + max_of_additional)
Bootstrap Statistics : original bias std. error t1* -0.41 0.0012 0.11 BOOTSTRAP CONFIDENCE INTERVAL CALCULATIONS Based on 10000 bootstrap replicates
CALL : boot.ci(boot.out = bootresults, conf = 0.95, type = “norm”)
Intervals : Level Normal
95% (-0.6316, -0.1954 )
Calculations and Intervals on Original Scale
In this section, we provide results from analysis that were not pre-registered.
Correlation of various behavioral measures
We present the correlation between some variables that shed light on the main results.
Correlation Three Rolls
| distance | report_roll | max_of_additional | when6 | total_6_T2 | |
|---|---|---|---|---|---|
| distance | |||||
| report_roll | 0.65**** | ||||
| max_of_additional | 0.04 | 0.04 | |||
| when6 | 0.01 | -0.01 | 0.71**** | ||
| total_6_T2 | 0.00 | 0.03 | 0.70**** | 0.92**** | |
| last_outcome | -0.01 | -0.02 | 0.58**** | 0.47**** | 0.40**** |
Correlation Free Rolls
| distance | report_roll | roll_more_than_once | total_rolls | max_of_additional | when6 | total_6_T2 | |
|---|---|---|---|---|---|---|---|
| distance | |||||||
| report_roll | 0.60**** | ||||||
| roll_more_than_once | 0.35**** | 0.10 | |||||
| total_rolls | 0.20*** | 0.03 | 0.60**** | ||||
| max_of_additional | 0.36**** | 0.13* | 0.96**** | 0.64**** | |||
| when6 | 0.25**** | 0.11* | 0.53**** | 0.43**** | 0.65**** | ||
| total_6_T2 | 0.15** | 0.05 | 0.50**** | 0.79**** | 0.61**** | 0.58**** | |
| last_outcome | 0.22**** | 0.13* | 0.33**** | 0.68**** | 0.40**** | 0.40**** | 0.54**** |
Correlation Single Roll
| steal | throw_1 | |
|---|---|---|
| steal | ||
| throw_1 | -0.21* | |
| last_roll | -0.08 | 0.15 |
Text insights
We gave the participants the chance to write down any comments they wish to statw at the end of the experiment. The text we got created some interesting insights that we wanted to document here as well.
We have 1226 comments in total across all treatments.
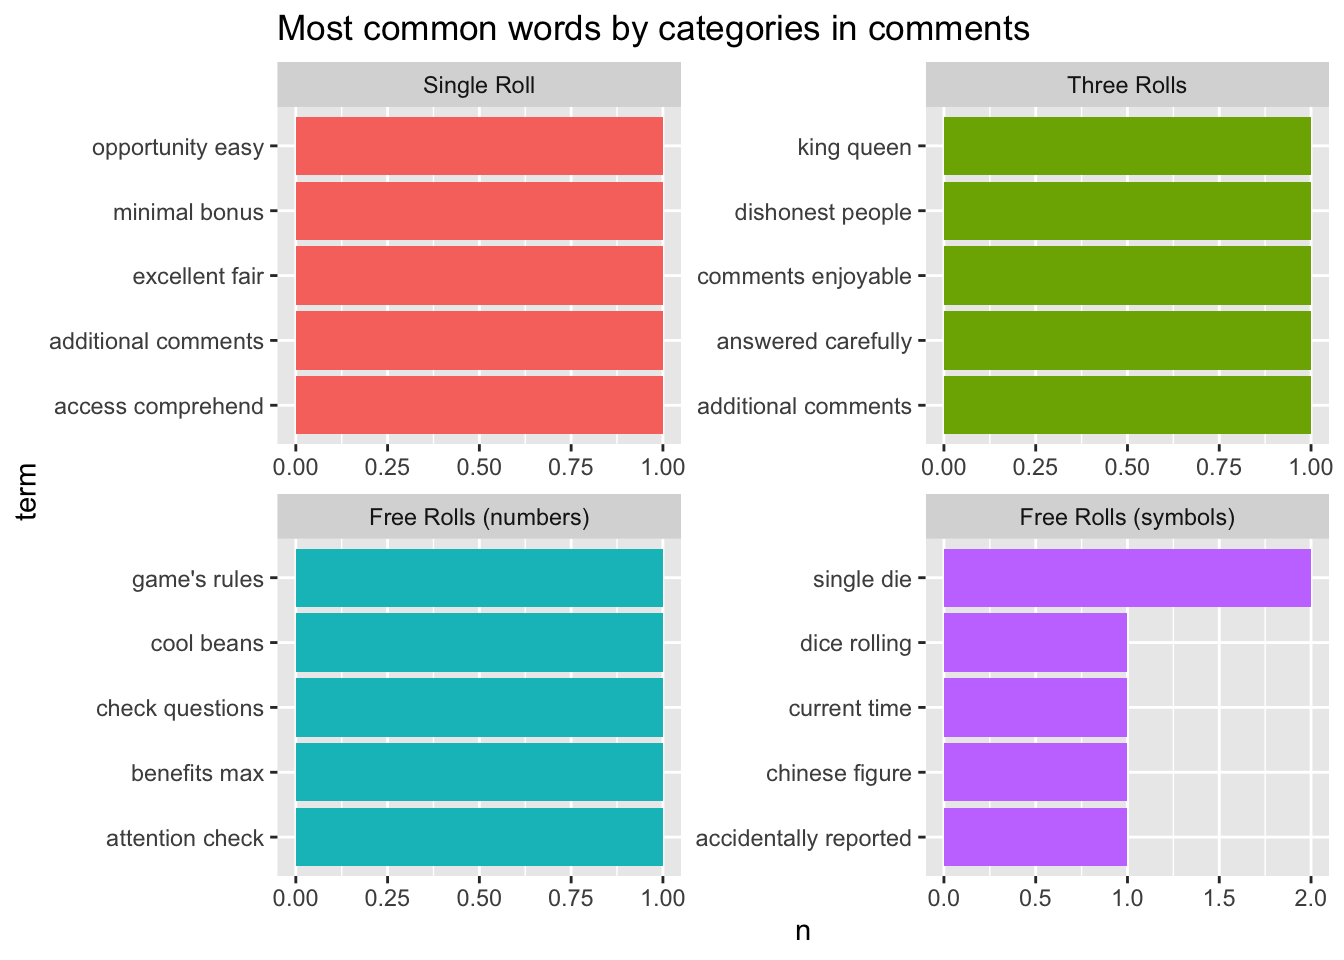
Topics
Below we show common topics in all comments without splitting into the treatments.
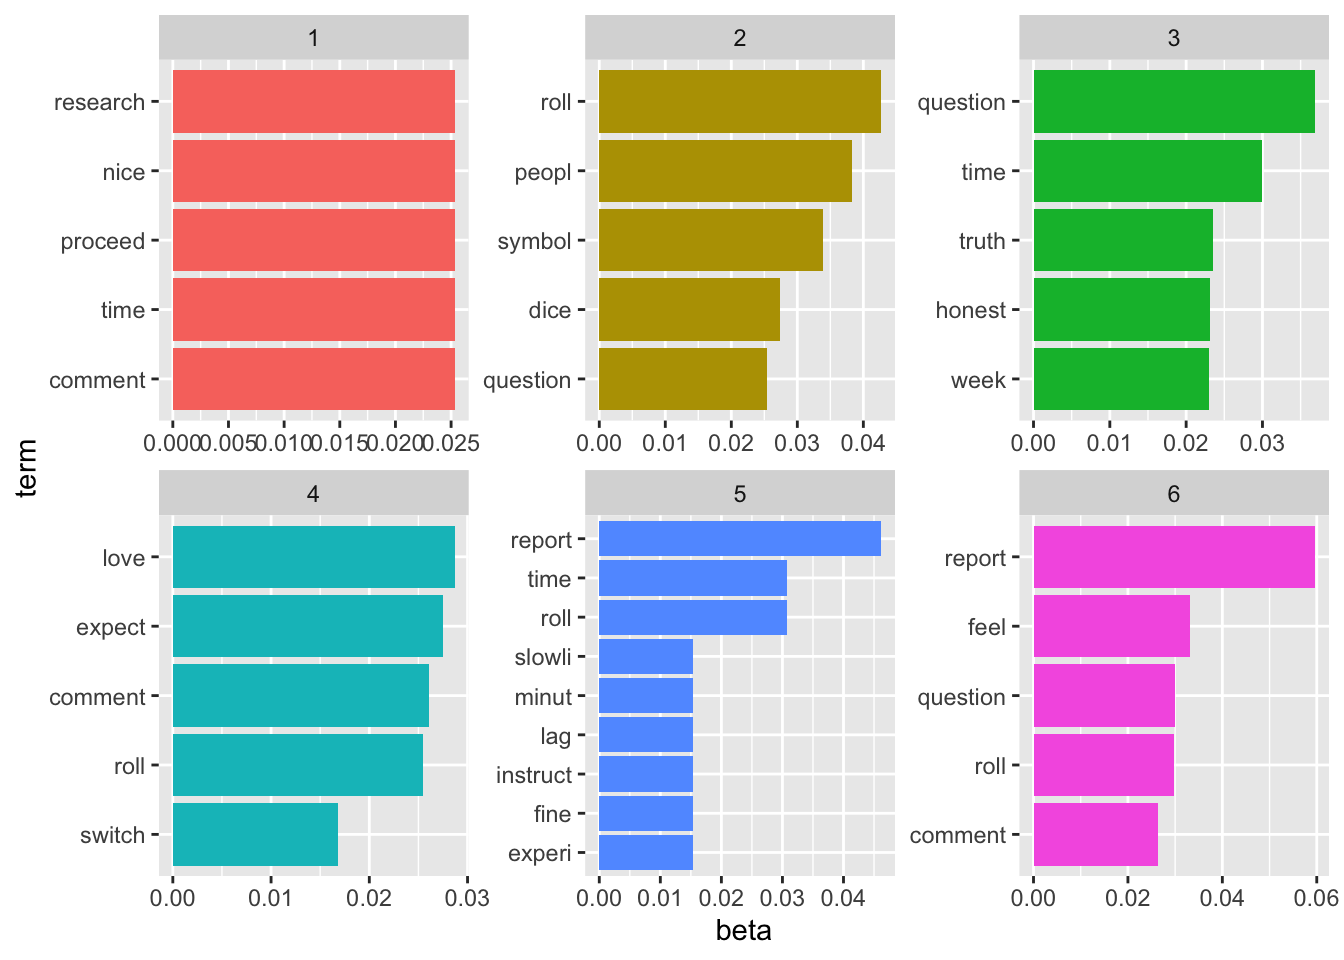
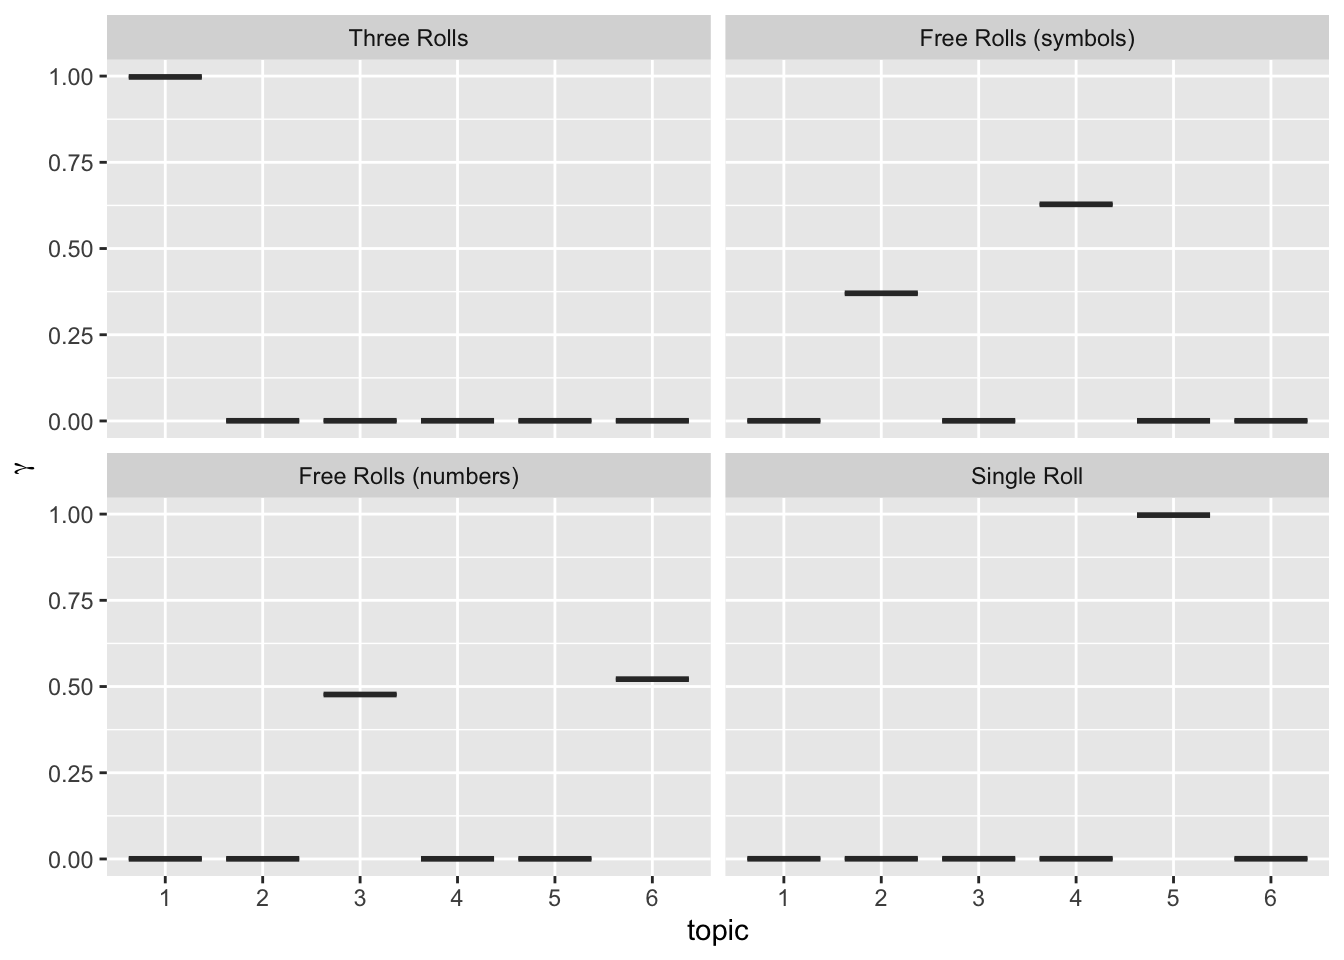
Now we matched these identified topics to treatments and check which one is more popular in which treatment. What we observe is, in the Single Roll Topic 5 and Three Rolls treatment Topic 1 is the most popular, and in Free Rolls (numbers) the most popular topic is 3 (ang 6) and 4 followed by 2 in the Free Rolls (symbols). When paying attention, only in Topic 3 we can observe honesty coming forward and only in Free Rolls (numbers) condition we observe this topic being popular among comments.
Without Filtering of Negative Lies
In the formal analysis, we exclude the participants who reported lower number than what they saw in their first roll, or those with negative lies.
In this section, we provide the main results from our paper without filtering for the negative lies. For all treatments, in total 21 participants are excluded in the formal analysis.
Descriptive Statistics
The table below shows the descriptive statistics about the sample by treatments. As can be seen the general composition and behavior of our sample do not change when those with negative lies are not filtered.
| Single Roll | Three Rolls | Free Rolls (numbers) | Free Rolls (symbols) | p.overall | |
|---|---|---|---|---|---|
| N=409 | N=388 | N=397 | N=386 | ||
| age | 39.0 (12.5) | 38.3 (10.5) | 38.7 (12.1) | 37.8 (11.5) | 0.555 |
| sex_f | 0.45 (0.50) | 0.44 (0.50) | 0.48 (0.50) | 0.47 (0.50) | 0.701 |
| education: | 0.587 | ||||
| High school or less | 45 (11.0%) | 44 (11.3%) | 53 (13.4%) | 40 (10.4%) | |
| Higher than highschool | 364 (89.0%) | 344 (88.7%) | 344 (86.6%) | 346 (89.6%) | |
| political | 3.18 (2.43) | 3.45 (2.37) | 3.48 (2.49) | 3.39 (2.39) | 0.283 |
| total_rolls | 1.00 (0.00) | 3.00 (0.00) | 4.98 (15.5) | 4.82 (17.6) | <0.001 |
| practice_rolls | 5.02 (5.42) | 4.98 (6.62) | 4.92 (5.85) | 5.42 (6.77) | 0.664 |
| report_roll | 3.94 (1.79) | 4.15 (1.72) | 3.92 (1.76) | 4.12 (1.66) | 0.125 |
| observe | 6.77 (3.13) | 6.82 (3.36) | 6.98 (3.21) | 7.02 (3.25) | 0.636 |
| legit | 3.73 (3.75) | 2.35 (3.08) | 3.32 (3.72) | 3.32 (3.70) | <0.001 |
| curious | 4.20 (3.42) | 5.77 (3.34) | 4.31 (3.80) | 4.15 (3.48) | <0.001 |
Dishonesty
We start our analysis by investigating the dishonest behavior across treatments.
When we check the intensive margin of the lie, we observe that those with negative lies causes some changes in the values, particularly in the Free Rolls (numbers) treatment we observe 0.08 decrease in the mean magnitude of the lie.
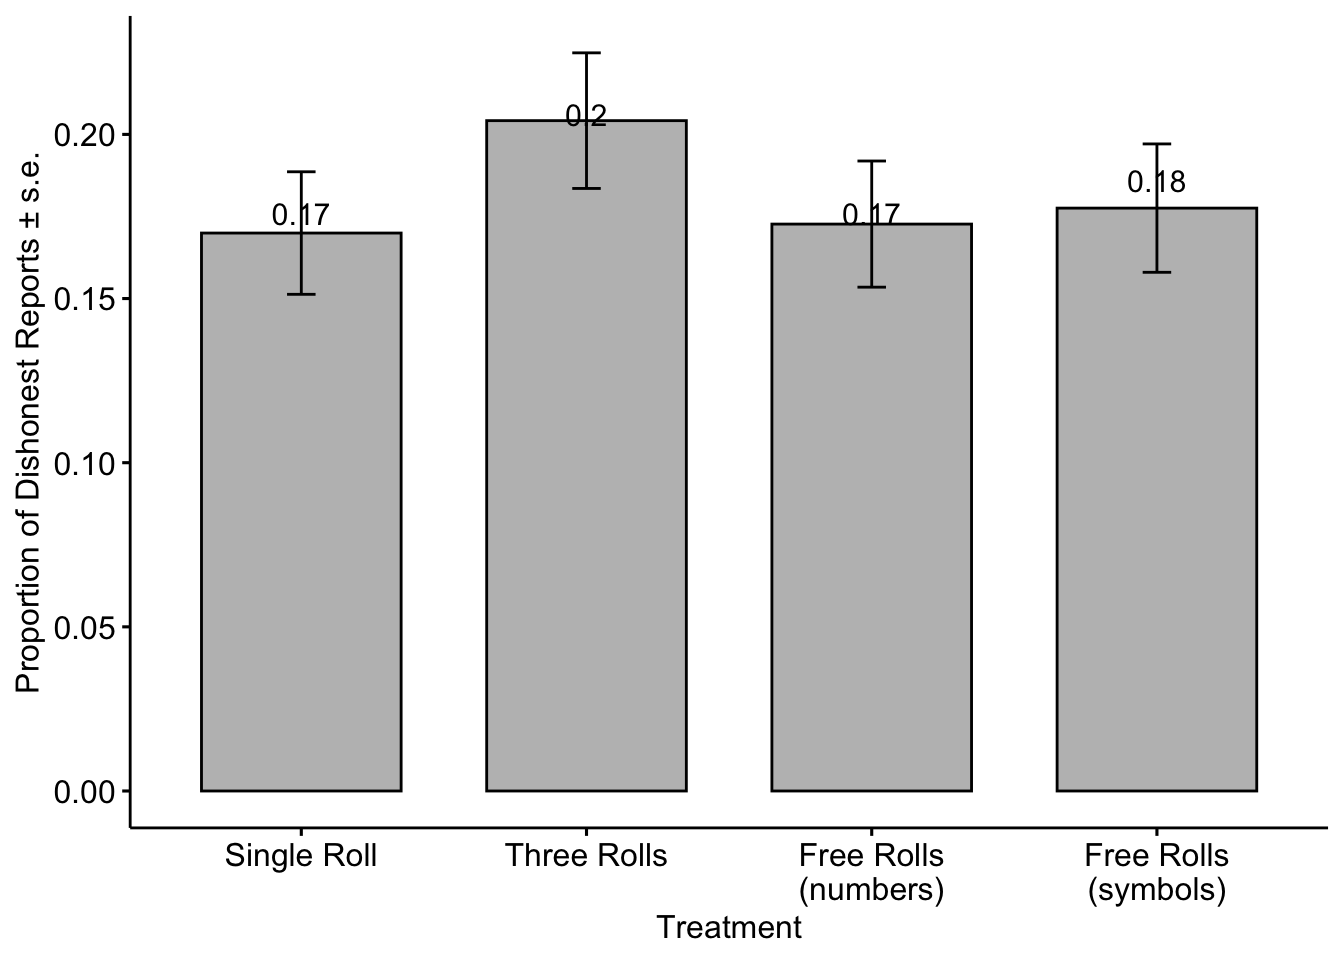
The figure below shows the proportion of dishonest reports in each treatment or extensive margin of the lie with the unfiltered data. We see the effect of negative lies particularly in Three Rolls and Free Rolls (numbers).